
A few years ago, I thought becoming a data analyst meant being good at mathematics and spending your entire day writing complicated code.
Then I started looking at what entry-level analysts actually do.
A surprising amount of the work is much more practical: cleaning messy spreadsheets, asking the right business questions, finding patterns in data, building dashboards, and explaining what the numbers actually mean to someone who doesn’t work with data.
That is exactly where the Google Data Analytics Professional Certificate caught my attention.
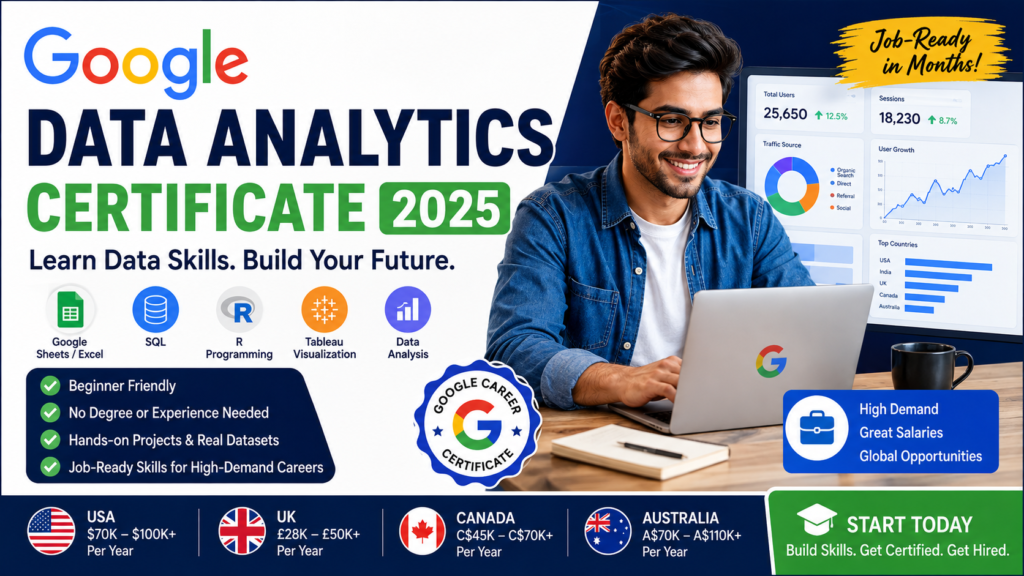
It isn’t a replacement for years of university education or professional experience. But for someone starting from zero, it provides a structured way to learn spreadsheets, SQL, R, Tableau, data visualization and the basic workflow used by junior data analysts.
Google’s current program is an 8-course series, designed for beginners and available through Coursera. Google says learners can complete it in roughly 3–6 months, with fewer than 10 hours of study per week. The program contains about 240 hours of learning and practice according to Google’s current regional program information.
So the real question isn’t simply, “Is the Google certificate good?”
The better question is:
Can this certificate help you become employable if you don’t already have a data analytics background?
Let’s break it down.
What is Google Data Analytics Certificate?
The Google Data Analytics Professional Certificate is an online training program created by Google and hosted on Coursera.
It is specifically aimed at beginners, which means you don’t need a data analytics degree or previous professional experience to start.
The current program teaches the basic workflow of a junior or associate data analyst, including how to prepare, clean, analyze, visualize and communicate data. Google lists tools such as spreadsheets, SQL, R programming and Tableau as part of the curriculum.
You also work with tools such as:
- Google Sheets or Microsoft Excel
- SQL
- Tableau
- RStudio
- Kaggle
- PowerPoint or Google Slides
- R and R-based visualization tools
One thing worth clarifying is Python.
You’ll see Python mentioned everywhere in data analytics job descriptions, but the foundational Google Data Analytics Certificate teaches R rather than Python. Google explicitly recommends exploring Python later if you want to continue developing your analytics skills.
That isn’t necessarily a disadvantage.
R is still useful for statistics and data analysis, and learning one programming language makes it easier to understand another later.
The certificate also includes a hands-on case study that you can use as a starting point for your portfolio.
And that’s important.
A certificate tells an employer that you completed training.
A portfolio shows what you can actually do.
Why Data Analytics is Future in 2025
If you were considering data analytics in 2025, there was a good reason to take the field seriously.
Businesses were collecting more data than ever, but collecting data isn’t the same as knowing what to do with it.
Imagine an online store with 100,000 monthly visitors.
The owner might know that traffic increased by 20%, but that’s not enough.
A good analyst might discover that:
- Mobile visitors convert less than desktop visitors.
- Customers from one region have unusually high repeat purchases.
- One advertising channel generates lots of clicks but very few sales.
- Customers who buy one product are likely to buy another product within 30 days.
Those findings can change business decisions.
That is the real value of analytics.
And artificial intelligence hasn’t eliminated that need.
If anything, AI has made the ability to understand and evaluate data more important. AI tools can generate SQL queries, summarize datasets and create charts, but someone still needs to check whether the analysis makes sense.
That’s one lesson I would take seriously.
Don’t try to compete with AI at doing repetitive calculations. Learn how to ask better questions, verify results and explain what the data means.
Google describes data analysts as people who collect, transform and organize data to help businesses make informed decisions.
The demand also isn’t limited to technology companies.
Data analysts can work with:
- E-commerce
- Banking
- Healthcare
- Marketing
- Education
- Retail
- Manufacturing
- Logistics
- Government
- Software companies
That’s what makes the skill attractive.
You aren’t necessarily choosing one industry for the rest of your career.
Salary Expectations (USA, UK, Canada, Australia)
Let’s deal with salary expectations carefully because this is where online articles often become unrealistic.
The Google certificate does not guarantee a particular salary.
Your income will depend on your location, experience, industry, portfolio, technical skills and job title.
USA
The U.S. Bureau of Labor Statistics reports a $91,290 median annual wage for operations research analysts in May 2024, with employment projected to grow 21% between 2024 and 2034. This is a related analytical occupation, not a salary promise for Google certificate graduates.
For someone entering the field, junior data analyst and business analyst positions may pay considerably less than experienced analytical roles.
As you gain experience with SQL, dashboards, statistics, business intelligence and Python, your options can expand.
UK
The UK’s National Careers Service lists £24,000 for starter-level market research data analysts and up to £50,000 for experienced professionals. Actual salaries vary by employer, specialization and location.
London and other major employment centers can have different salary levels from smaller cities.
Canada
Canadian government Job Bank data for data analyst–informatics and systems roles currently shows national wages of approximately C$25.00/hour at the low end, C$40.87/hour at the median and C$61.03/hour at the high end.
For business data analysts, the current national median is about C$45.13/hour.
Again, these figures describe occupations rather than people who have specifically completed Google’s certificate.
Australia
Australia’s Jobs and Skills Australia reports median full-time earnings of A$2,697 per week for ICT business and systems analysts, with median hourly earnings of A$72 in its latest published figures.
That occupation is broader and more experienced than an entry-level data analyst position, so beginners shouldn’t assume they will immediately earn this amount.
The general lesson across all four countries is simple:
Use salary figures as a long-term reference, not as a promise attached to the certificate.
Your first job is usually about getting experience.
Your second or third role is where specialization can start making a much bigger difference.
Complete Course Breakdown – What You’ll Learn
The certificate is currently structured as eight courses.
The exact course presentation can change over time, but the learning path generally takes you through the complete analytics workflow.
1. Foundations of Data Analytics
You start by understanding what data analytics actually means.
You’ll learn about:
- Types of data
- Data-driven decision-making
- Analytical thinking
- The role of a data analyst
- The analytics process
- Data ethics
This sounds basic, but don’t skip it.
When I first started looking at analytics, the temptation was to jump straight into SQL.
That was a mistake.
Knowing how to query a database is useful, but knowing what question you’re trying to answer is much more important.
2. Asking the Right Questions
A strong analyst doesn’t begin with:
“Let me open Excel.”
They begin with:
“What problem are we trying to solve?”
For example, a restaurant might say:
“Our sales are falling.”
That’s not a good analytical question yet.
You could break it down:
- Which products are selling less?
- When did the decline start?
- Did customer traffic change?
- Did average order value change?
- Did prices change?
- Did competitors launch promotions?
Good questions lead to useful analysis.
Bad questions lead to pretty charts that nobody uses.
3. Preparing and Cleaning Data
This is probably one of the least glamorous parts of analytics.
It is also one of the most important.
Real-world datasets are messy.
You may encounter:
- Missing values
- Duplicate records
- Incorrect dates
- Inconsistent names
- Different measurement formats
- Spelling errors
- Unnecessary columns
The certificate teaches you how to prepare data before analyzing it. Google includes spreadsheets, SQL and R in this workflow.
This is where beginners often learn an important lesson:
If your input data is bad, your beautiful analysis can still be wrong.
4. Spreadsheet Analysis
You’ll work with spreadsheet concepts such as formulas, sorting, filtering, calculations and data organization.
Excel and Google Sheets may not sound exciting, but don’t underestimate them.
Many companies still use spreadsheets every day.
A junior analyst who can confidently manipulate a messy spreadsheet is already useful.
5. SQL
SQL is one of the most valuable skills in the certificate.
You’ll learn how to retrieve and manipulate information stored in databases.
For example, imagine an e-commerce database containing millions of orders.
Instead of manually searching through the data, SQL lets you ask questions such as:
- Which products generated the most revenue?
- Which customers purchased more than once?
- What were total sales by month?
- Which region had the highest average order value?
That is where analytics starts becoming powerful.
6. R Programming
The foundational certificate uses R for analysis rather than Python.
You don’t need to become a software engineer.
You’ll use R to work with datasets, perform analysis and create visualizations.
If you’re completely new to programming, expect the first few sessions to feel uncomfortable.
That’s normal.
The goal isn’t memorizing every command.
It’s understanding how to use code to work with data.
7. Data Visualization
A spreadsheet full of numbers isn’t particularly useful to a manager.
A well-designed dashboard can communicate the same information much faster.
The program introduces visualization and tools such as Tableau.
You’ll learn how to present patterns and findings using charts, dashboards and presentations.
One of the biggest lessons here is that more charts don’t mean better analysis.
A simple chart that answers one important question is often better than a dashboard containing 25 confusing graphs.
8. The Capstone Case Study
The final project brings everything together.
You’ll work through a case study where you apply the analytical process from beginning to end.
This is the part you should take most seriously if your goal is employment.
Don’t think of it as merely another assignment.
Think of it as your first portfolio project.
Is It Better Than a Bachelor’s Degree?
No — and I wouldn’t market it that way.
A Google certificate and a bachelor’s degree serve different purposes.
A bachelor’s degree gives you several years of broader education, including theory, mathematics, communication, research and potentially internships or university projects.
The Google certificate is much narrower.
Its advantage is speed and accessibility.
Google states that its Career Certificates are designed for entry-level job skills and don’t require a relevant degree or previous experience.
For someone who already has a bachelor’s degree in another subject, the certificate can be particularly interesting.
Imagine someone with a business, economics, marketing or engineering degree who wants to move toward analytics.
They don’t necessarily need to spend another four years studying.
A focused certificate can help fill specific technical gaps.
There is also an interesting middle ground: Google says some Career Certificate graduates may receive recommendations for college credit, potentially up to 12 credits, depending on participating institutions and programs.
So I wouldn’t ask:
“Certificate or degree?”
I’d ask:
“What does my target job actually require?”
For some jobs, a degree may still be strongly preferred or required.
For others, skills, projects and experience can matter much more.
Jobs You Can Get With This Certificate
The certificate is designed around entry-level data analytics work.
Potential job titles include:
- Junior Data Analyst
- Data Analyst
- Associate Data Analyst
- Business Analyst
- Marketing Data Analyst
- Operations Analyst
- Reporting Analyst
- Data Technician
- Junior Business Intelligence Analyst
Your first job might not contain the exact words “Data Analyst.”
That’s another thing beginners often overlook.
For example, a reporting specialist may spend much of their day working with spreadsheets, dashboards and business data.
That experience can become a stepping stone toward a dedicated analytics position.
Your portfolio can also help.
A recruiter may be far more interested in seeing:
SQL + Tableau dashboard + case study + clear explanation
than simply seeing:
Google Certificate
on a resume.
Success Stories: Real People Who Changed Careers
This is one area where Google’s own graduate stories are useful because they show that people don’t all enter analytics through the same route.
Take Scott Howard from Newcastle, Australia.
Scott spent 14 years working as an electrician and had also completed a mathematics degree with a statistics major. He found that the degree alone wasn’t giving him the practical skills he needed to land the type of role he wanted.
He completed the Google Data Analytics Certificate in about five weeks while studying full-time.
After completing it, he landed his first data analyst job at an agribusiness startup and later moved into a more senior role.
That’s a particularly interesting story because it demonstrates something important:
Career switching doesn’t always mean starting from zero.
Scott already had problem-solving and quantitative experience. The certificate helped him translate those existing skills into a new professional direction.
There are also examples from Pakistan.
Google’s Pakistan graduate stories feature Tooba Ahmed Alvi, who used the Data Analytics program and later landed a programmer analyst position at a top university. Google describes her as continuing to build toward a future in data science.
Another graduate, Afreen Rahat, completed Data Analytics and Digital Marketing courses and went on to work as a freelancer and blogger.
These stories are encouraging, but they shouldn’t be interpreted as guaranteed outcomes.
For every success story, there are people who complete a certificate and still need months of applications, networking, additional learning and practice.
That’s normal.
A certificate can help change your direction.
It doesn’t remove the work required to build a career.
How to Pass the Final Project (Tips & Tricks)
The final project is where I would slow down rather than speed up.
Here are the strategies I’d use.
1. Understand the business question first
Before touching the dataset, write down:
What problem am I solving?
If you can’t explain the problem in one or two sentences, you’re probably not ready to analyze the data.
2. Inspect the data before making conclusions
Look for:
- Missing values
- Duplicates
- Strange values
- Incorrect formats
- Outliers
- Inconsistent categories
Don’t immediately create charts.
First understand what you’re working with.
3. Keep a record of your cleaning decisions
If you remove duplicate rows, explain why.
If you change a column format, document it.
If you exclude certain records, explain the reason.
This makes your analysis easier to defend.
4. Ask several questions instead of one
Don’t stop after finding one interesting number.
For example, if sales increased, ask:
- Why?
- Which products increased?
- Which customer segment changed?
- Which region contributed most?
- Was the increase temporary?
- Did marketing activity change?
This turns basic reporting into actual analysis.
5. Don’t overload your dashboard
This was one of the mistakes I would avoid completely.
Beginners often think an impressive dashboard needs lots of colors, charts and numbers.
It doesn’t.
Use a small number of useful visualizations.
Each chart should answer a question.
6. Explain your findings in normal English
Don’t write:
“The temporal aggregation demonstrates a statistically significant upward movement in the revenue distribution.”
If you can say:
“Sales increased steadily during the final three months, mainly because repeat customers purchased more frequently.”
Say that instead.
Your manager isn’t grading your vocabulary.
They want to understand the result.
7. Turn the project into a portfolio piece
Once you’ve finished, don’t let the project disappear inside Coursera.
Clean it up.
Create a short case study showing:
Problem → Data → Cleaning → Analysis → Visualization → Findings → Recommendation
You can publish it on a personal portfolio, GitHub or LinkedIn.
That’s much more valuable during a job search.
8. Learn Python afterward
If you’re serious about continuing in analytics, I’d recommend adding Python after completing the foundational certificate.
Google’s introductory program teaches R, while its separate Advanced Data Analytics Certificate uses Python, Jupyter Notebook, Tableau, machine learning and predictive modeling.
That creates a natural progression:
Google Data Analytics → SQL + R + Tableau → Python → Advanced Analytics
You don’t need to learn everything simultaneously.
Build the foundation first.
Final Thoughts
The Google Data Analytics Certificate isn’t a shortcut around education.
It’s a shortcut around some of the confusion that comes with starting from scratch.
You get a structured curriculum, practical exercises, exposure to industry tools and a recognizable credential from Google.
But the people who get the most value from it are usually the ones who go beyond the certificate.
Learn SQL properly.
Build dashboards.
Analyze real datasets.
Practice explaining business problems.
Create portfolio projects.
Apply for internships and entry-level roles even if you don’t meet every requirement.
And don’t be discouraged when your first applications don’t work.
Data analytics is one of those fields where your progress becomes much easier to see once you can point to actual work and say:
“Here is the problem. Here is the data. Here is what I discovered. And here is what I recommend the business should do.”
That conversation is much more powerful than simply saying, “I completed a Google certificate.”